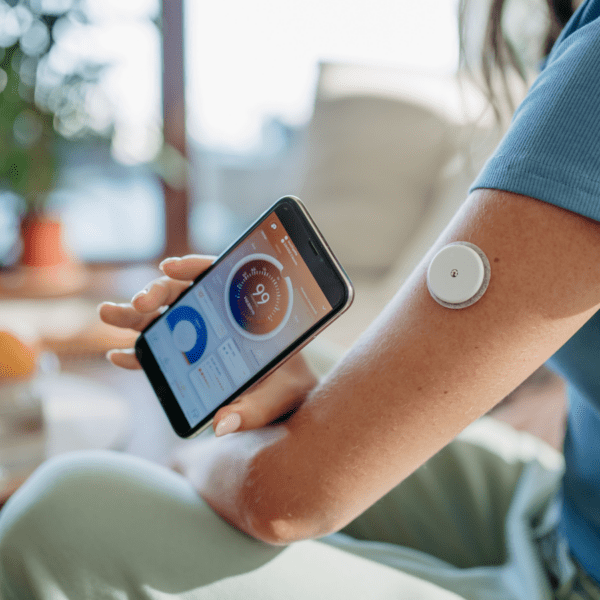

High blood glucose can lead to many health issues including nerve damage, damage to your heart, vision problems as well as damage to your kidneys. Persistently high blood glucose results in a diagnosis of diabetes. A continuous glucose monitor (CGM) gives you glucose information throughout the day and night.
Since the 1960s, if you wanted to test your blood glucose level, the way you did it was by pricking your finger and placing a drop of blood on a paper strip. Rather than rely on incomplete “point-in-time” data, CGMs monitor your blood glucose levels 24/7. This data can help you make food choices that do not result in a high blood sugar.
Dr. Laura’s food experiments
Here’s a snapshot of data from when Dr. Laura ate a high-carbohydrate bagel as an experiment to test the impact on her glucose. You will see that her glucose skyrocketed twice from the high-carbohydrate food choice:
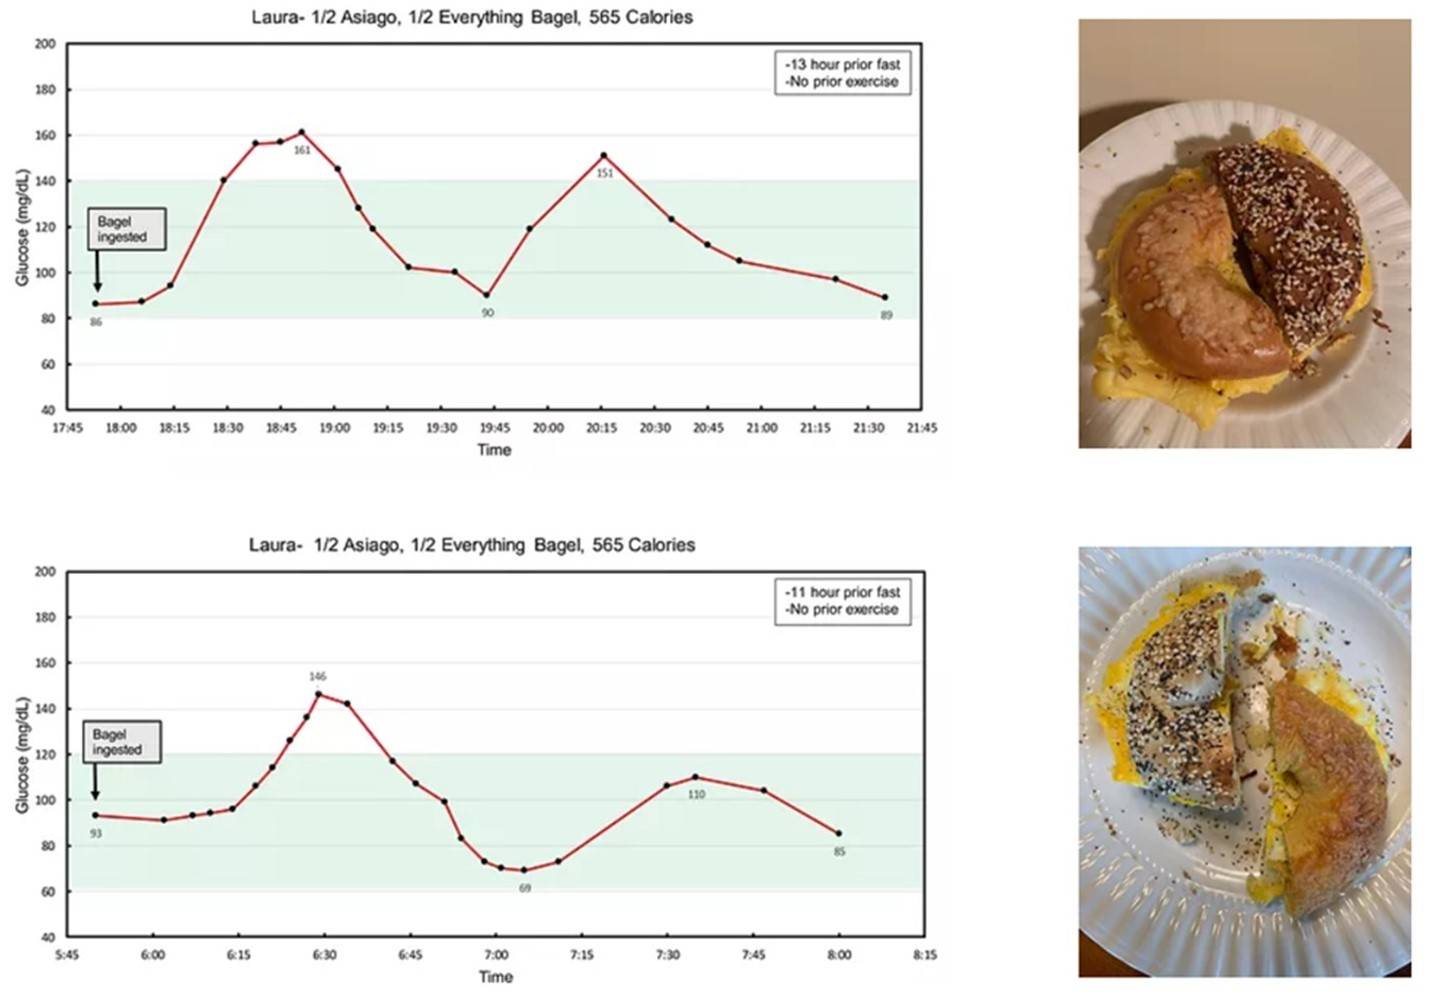 Dr. Laura’s CGM trace after her high-carbohydrate bagel experiment Open full-size image
Here’s data from a low-carb meal. You can see that her blood glucose was much more stable:
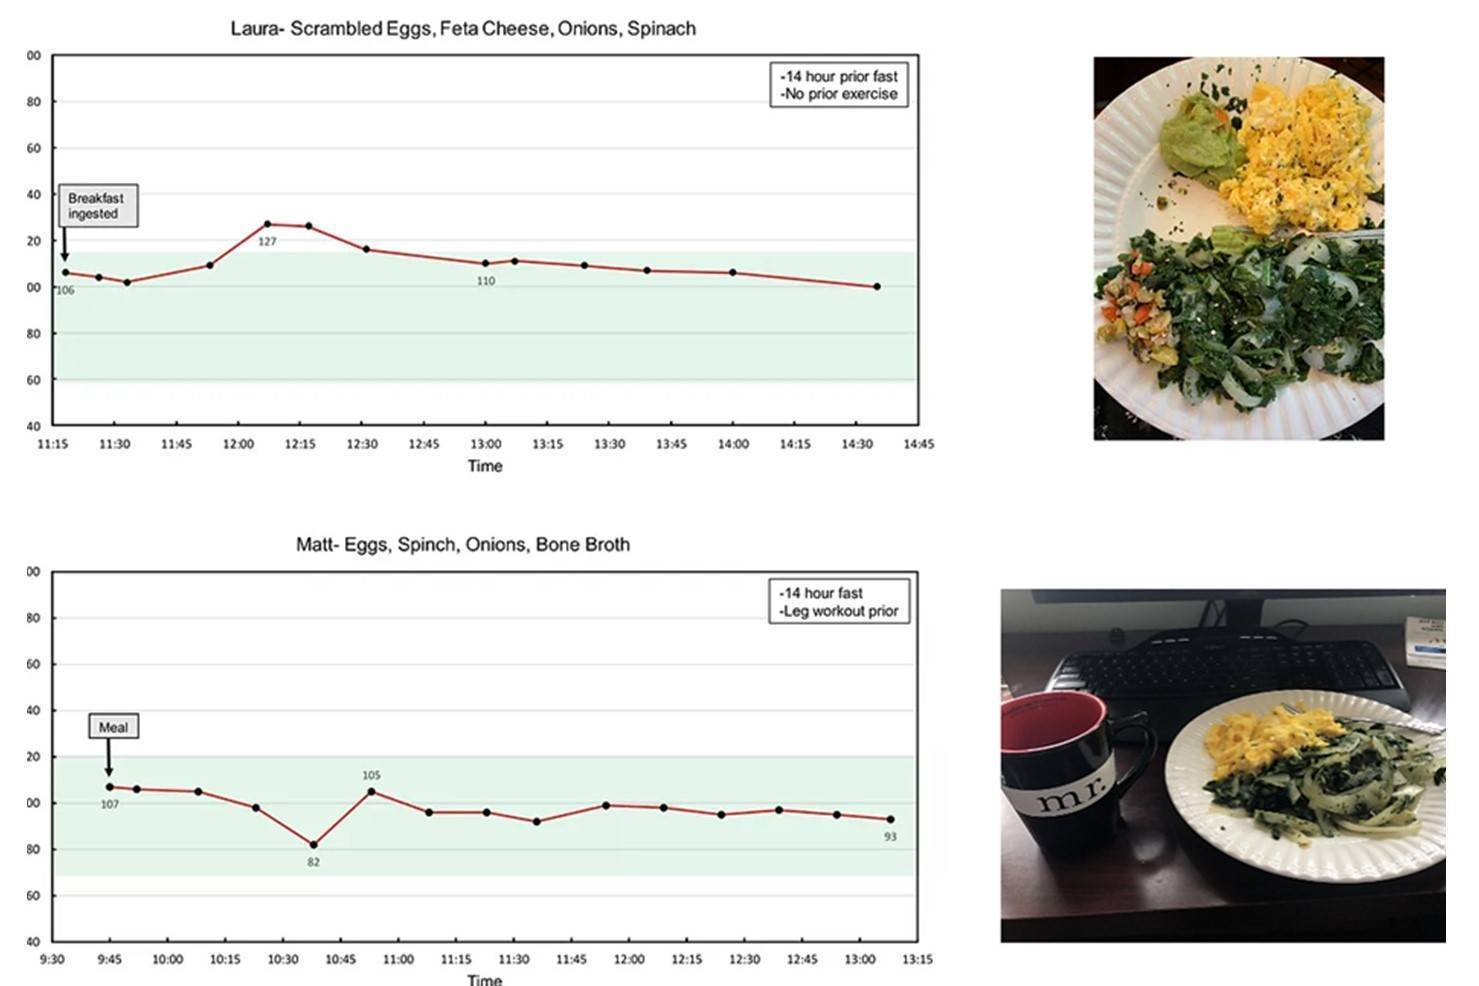 Dr. Laura’s CGM trace following a low-carbohydrate meal Open full-size image
Why continuous monitoring adds to a point-in-time reading
Using “point-in-time” data to figure out what is going on with your blood glucose is like trying to figure out what a movie is about by scanning through pictures of individual scenes. You might pick up on the gist of things, but you are not learning the full story. When it comes to blood glucose, it is important to know:
- How far it’s moving from lows to highs, called the “glycemic variability”
- How long it takes to recover back to baseline after a spike
- How long it stays in the target range, called the “time-in-range”
- How high is the fasting morning blood sugar, which is one of the ways to diagnose pre-diabetes or type 2 diabetes.
What’s more, because it’s easy to get immediate feedback, you can very easily start to connect blood glucose levels to specific foods, activities (e.g. taking a walk after a meal), and even stress levels.
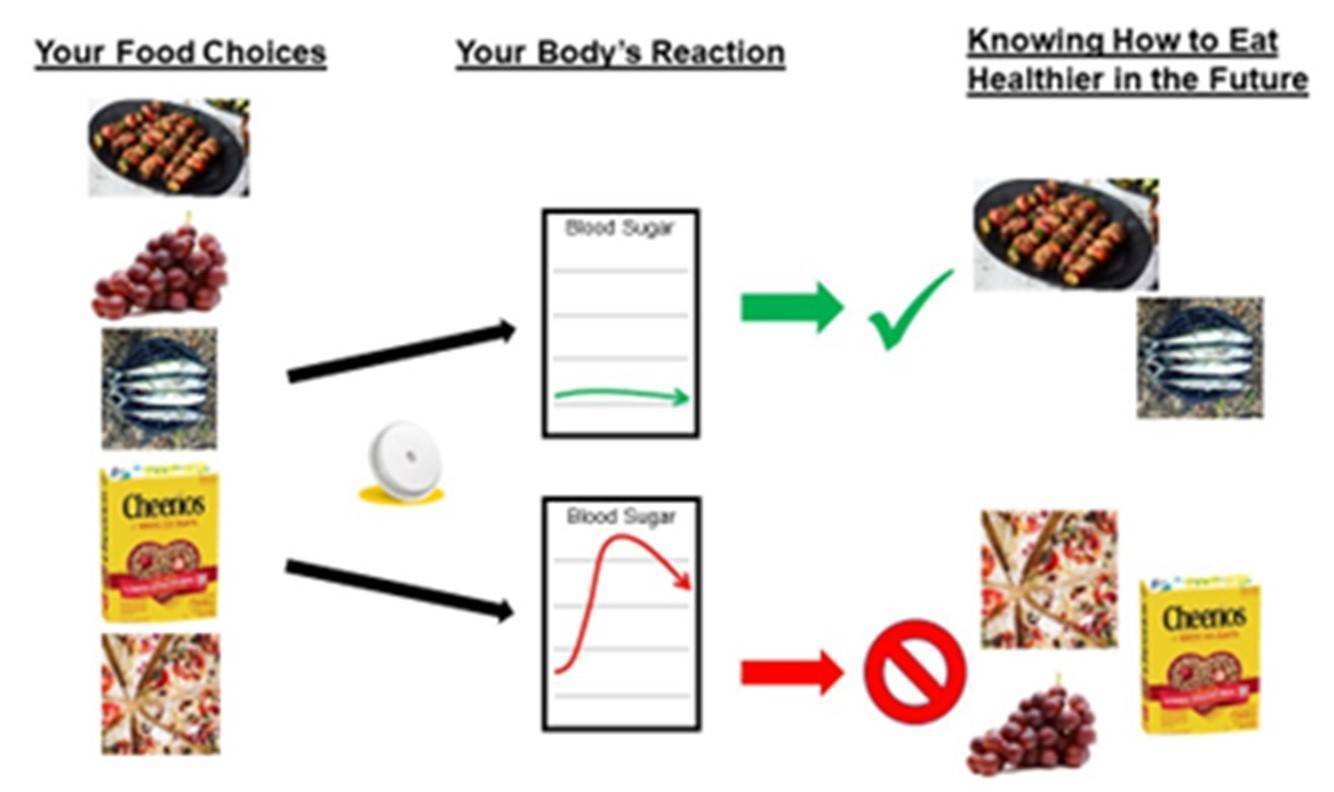 Diagram showing a feedback loop between glucose readings and daily choices. Open full-size image
Often, weight loss can take weeks of lifestyle change, particularly to see the results on the scale. The use of the CGM can support lifestyle change in real time, giving you almost immediate feedback on how your lifestyle choices are affecting your blood glucose levels.
Who can use this information?
A very common misconception is that CGMs are only for people living with diabetes. Nothing could be further from the truth. Your personal individual responses to foods may help clue you in to ways to optimize your health, and CGMs are also an invaluable resource in deciphering the true impact of different foods on blood glucose levels. For example, there was a type of “healthy”, whole-grain oat cookie that Laura used to eat all the time. After wearing a CGM she realized that the cookies, despite what the ingredients label claimed they were made of, were spiking her glucose to 180. You can’t truly understand what most foods are going to do to your blood sugar without wearing a CGM. Not all foods have the same impact on all people – so even if we could trust what was on every package, it still is not enough. Furthermore, glucose patterns can affect energy levels and sleep quality, which is another reason people from all backgrounds are choosing to wear them.
Stress is another really interesting reason to wear a CGM. When we are stressed out, our bodies enter “fight or flight” mode, spiking cortisol and epinephrine. In response, our body floods us with glucose (for energy) so that we can be ready to “run from a wolf.” Obviously, there are not any wolves in the modern world so what ends up happening is the glucose our body creates in reaction to stress just stays in our system, which can contribute to poor health. A CGM will tell you if your body is responding to stress in this way.
Who should wear a CGM? We think the answer is most people, particularly those with prediabetes and diabetes. Soon the better question to ask might be: Who shouldn’t wear a CGM?
A few terms you will see
These terms provide a starting point. Part 2 explains how to read a CGM report in more detail.
-
A1c. A measure of your average blood sugar levels over the past 3 months. This chart from the Mayo clinic shows the ranges for “No diabetes” and “Pre-diabetes”:
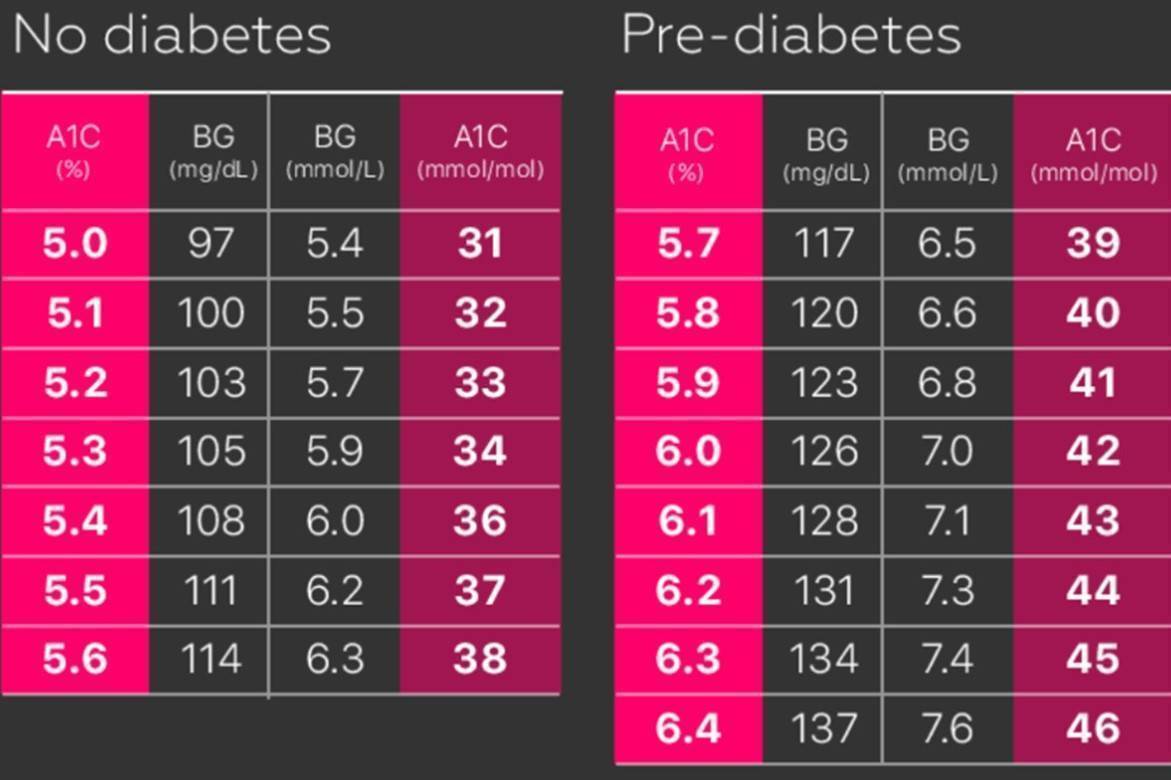 Mayo Clinic reference graphic comparing A1C and estimated average glucose. Open full-size image
 -
GMI stands for Glucose Management Index. This is what your CGM data would predict to be your A1c score. Note that differences between GMI and A1c are likely, and are usually due to not wearing the CGM consistently enough. For example, if you only wear your CGM 50% of the time, then A1c will be measuring your actual average blood sugar, whereas the GMI prediction will be based on only having half of the data.
-
Glycemic/Glucose Variability. This is a measure of how far glucose readings vary from the mean (average) or median (midpoint) glucose readings. It’s looking both at the degree of up and down fluctuations (amplitude) and the frequency of variation.
-
Time in Range is the percent of time spent inside your target range – which will be represented on your CGM app by the green shaded area. Higher is better.
-
% Time CGM is effective (Data Sufficiency). Ideally, a CGM should be worn and scanned at least 70% of the time. This makes sure that the data the CGM captures is accurate and holistic enough to make health decisions. For example, that over a 2 week period you would want to have data for at least 10 days.
Next: How to Read CGM Data Without Feeling Overwhelmed.
Related course: Continuous Glucose Monitors (CGMs).
Nothing in this course or article should be considered personal medical advice. Always consult your doctor and medical team about your individual situation.