
A step-by-step guide to the main CGM metrics, repeat patterns, and questions to bring to your care team.
A continuous glucose monitor, or CGM, can turn something that once felt invisible into a detailed graph. It can show how glucose changes throughout the day and night—and how those changes may line up with meals, activity, stress, sleep, illness, and medication timing.
That information can be genuinely useful. It can also become overwhelming.
The goal is not to create a perfectly flat graph or judge every meal by a single number. A CGM is most helpful when it allows you to notice a repeatable pattern, add context, and make one thoughtful change at a time. If you use insulin or another medicine that can cause low glucose, interpretation and treatment decisions should follow your individualized care plan.
What does a CGM actually measure?
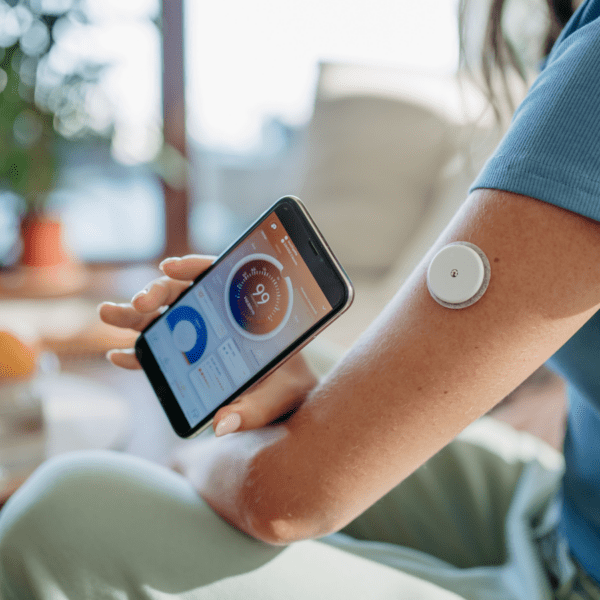
A CGM uses a small sensor worn on or under the skin to estimate glucose in the fluid between your cells, called interstitial fluid. It does not directly sample blood in the same way as a finger-stick meter or laboratory test. Most systems send a new estimate to a phone, receiver, or compatible device every few minutes.
Because interstitial glucose and blood glucose are measured differently, the two numbers may not match exactly. The difference can become more noticeable when glucose is rising or falling quickly. Sensor warm-up, pressure on the sensor, adhesion problems, transmission interruptions, and device-specific medication or supplement interference can also affect readings.
The National Institute of Diabetes and Digestive and Kidney Diseases provides a helpful overview of how CGMs work. Always follow the instructions for your specific device.
Before interpreting the graph, check the quality of the data
A report is only as useful as the data behind it. Before drawing conclusions, ask:
- How many days are included?
- Was the sensor active consistently?
- Were those days reasonably representative of my usual routine?
- Did illness, travel, an unusual schedule, or a sensor problem distort the sample?
For pattern assessment, current professional guidance commonly uses about 14 days with at least 70% active CGM data. A shorter sample can still raise useful questions, but it may not reliably represent your usual glucose patterns—especially less frequent low readings or day-to-day variability. The American Diabetes Association’s 2026 Standards of Care describe these standardized metrics and their limitations.
The five parts of a CGM report to review first
Many CGM systems generate an Ambulatory Glucose Profile, often called an AGP. This one-page report combines several days of data into a 24-hour view and summarizes the most useful metrics.
| Metric | What it tells you | A useful question |
|---|---|---|
| Data captured | How complete and representative the report may be | Is there enough usable data to look for a pattern? |
| Time below range | How often glucose was below the selected range | Are there possible lows that need prompt review? |
| Time in and above range | Where readings fell relative to the individualized target range | Is the pattern changing over time? |
| Average glucose and GMI | Average sensor glucose and a calculated estimate based on it | Does GMI differ from my laboratory A1C? |
| Variability and daily profile | How widely readings moved and when patterns repeated | Is the same pattern appearing at a similar time on several days? |
1. Review possible low glucose first
If you have diabetes, possible low readings deserve attention before you focus on highs or on creating a smoother graph. This is especially important if you use insulin, sulfonylureas, or another medicine that can cause hypoglycemia.
Look at time below range, when the readings occurred, and whether a similar pattern repeated. Confirm readings when your device instructions or symptoms indicate that you should. Recurrent lows warrant prompt discussion with your care team; severe symptoms such as confusion, seizure, unconsciousness, or inability to self-treat are an emergency.
2. Review time in, above, and below range together
Time in range (TIR) is the percentage of readings within a selected range. Time above range (TAR) and time below range (TBR) show what occurred outside it.
For many nonpregnant adults with type 1 or type 2 diabetes, the ADA lists general goals such as more than 70% of readings from 70–180 mg/dL, less than 4% below 70 mg/dL, and less than 1% below 54 mg/dL. These are examples for diabetes management—not universal wellness grades. Pregnancy, age, hypoglycemia risk, other health conditions, and treatment goals can require different ranges.
If you do not have diabetes, do not apply diabetes treatment targets to yourself or use an online graph to diagnose a condition. Your clinician can help determine which measures, if any, are relevant to you.
3. Understand average glucose and GMI
Average glucose summarizes the sensor readings collected during the reporting period. Glucose Management Indicator (GMI) uses that average in a population-based formula to estimate recent glucose exposure.
GMI is not a laboratory A1C, and the two values may differ. GMI reflects the CGM period and sensor data; A1C is a blood test influenced by glucose exposure as well as red-blood-cell biology and certain health conditions. A difference is not automatically evidence that one result is “wrong,” but a meaningful mismatch is worth discussing with your clinician.
Do not use GMI alone to diagnose diabetes or prediabetes, and do not call it “your A1C.”
4. Look at glucose variability in context
Variability describes how widely readings move around the average. Many reports express it as a coefficient of variation (CV).
A lower CV can mean readings are more consistent, but variability never tells the whole story. A relatively steady line at a persistently high level would not represent the same situation as a steady line in an individualized target range. Review variability alongside time below, in, and above range.
For many people with diabetes, professional guidance uses a CV of 36% or less as a general goal. As with time in range, that number is not a universal target for every person or for people without diabetes.
5. Use the daily profile to find repeat patterns
An AGP typically shows a middle line representing the median glucose at each time of day, surrounded by shaded bands. Wider bands suggest that readings were less consistent at that time. Daily traces can help you determine whether the summary reflects a repeat pattern or one unusual day.
Trend arrows add another layer: they show the direction and rate of change. A reading with a downward arrow means something different from the same number on a relatively steady line. Follow the instructions for your device and your established treatment plan when using trend arrows for diabetes management.
| Part of the report | What to look for |
|---|---|
| Middle line | Median glucose at each time of day. |
| Shaded bands | Wider bands show less consistency at that time. |
| Daily traces | Check whether the summary reflects a repeat pattern or one unusual day. |
| Trend arrows | Direction and rate of change; use your device instructions and established treatment plan. |
GMI is not the same as A1C
This distinction is important enough to repeat: GMI is a CGM-based calculation; A1C is a laboratory measurement.
GMI can provide useful context, especially between laboratory tests, but it should not replace appropriate diagnostic testing or individualized care. Differences may reflect the length or representativeness of the CGM period, sensor performance, recent changes in glucose, anemia, kidney disease, pregnancy, hemoglobin variants, altered red-cell turnover, or other factors.
Bring both results to your clinician rather than trying to force them to match.
A calmer three-pass method for reviewing CGM data
Instead of reacting to every point, review the report in three passes.
Pass 1: Check safety signals
Start with possible low readings, very high readings, symptoms, sensor warnings, missing data, and values that do not match how you feel. Follow your existing treatment and emergency plan. Confirm a surprising or symptom-mismatched reading with a finger-stick meter when your device guidance calls for it.
Pass 2: Look for repetition
Ask whether the same pattern appears at a similar time on several reasonably comparable days.
Useful questions include:
- Does this happen after the same meal more than once?
- Does it occur on exercise days, rest days, or both?
- Is the pattern limited to one unusual day?
- How long does it last before moving back toward the earlier level?
- Is the weekly pattern changing, or am I reacting to one moment?
Repeated patterns are generally more informative than isolated “spikes.”
Pass 3: Add context and choose one next step
Review meal timing and composition, physical activity, sleep, stress, illness, alcohol, and medication timing. These factors may influence the graph, but one event followed by one reading does not prove cause and effect.
If it is medically safe within your existing plan, choose one small, nonmedical variable to observe at a time. For example, compare your usual dinner on several days with the same dinner followed by a short walk. Medication or insulin changes should follow your clinician-guided plan, not an online article or one surprising trace.
Four types of patterns worth exploring
Food and meal patterns
A CGM may help you compare responses after different meals, meal sizes, or eating times. Record enough context to make the graph meaningful, but do not turn every ingredient into a permanent tracking project.
A relatively steady line does not certify a food as “healthy.” A CGM does not measure protein quality, micronutrients, fullness, cravings, digestive comfort, or whether a food supports your broader goals. Likewise, one noticeable rise does not tell the whole story about a meal.
For an experience-led companion article, read 8 practical lessons from reviewing 10,000 CGMs.
Exercise
Activity can affect glucose differently depending on the type, intensity, duration, timing, recent meals, medications, and the individual. A walk after a meal may look different from strength training or an intense interval workout. Some people see a temporary rise during vigorous activity, followed by a different pattern later.
A temporary rise does not automatically mean the workout was harmful. Compare similar sessions and discuss unexpected or concerning patterns with your care team.
Sleep
A short or disrupted night may coincide with different morning or daytime readings, appetite, energy, and food choices. Track sleep simply by noting bedtime, estimated duration, and whether it felt restful. Then compare several nights. Avoid making a major conclusion from one poor night and one unusual reading.
Stress and illness
Emotional stress, pain, infection, and other illness may coincide with changes in glucose. The graph can help you notice a possible pattern, but it cannot explain the cause by itself. Unexpected readings during illness, especially when accompanied by concerning symptoms, deserve appropriate medical guidance.
What if the CGM number does not match how you feel?
Do not ignore symptoms because an app shows a reassuring number.
Follow your device instructions. Current diabetes guidance recommends access to a finger-stick meter for situations such as a reading that seems inaccurate, symptoms that do not match the display, sensor warm-up or transmission failure, a device warning, or rapidly changing glucose. The ADA’s 2026 diabetes-technology guidance explains these situations in more detail.
Very high glucose accompanied by ketones, vomiting, trouble breathing, fruity-smelling breath, confusion, or fainting may indicate a medical emergency. Seek urgent or emergency care according to your established plan and local guidance.
How to prevent CGM data overload
More data does not always create more clarity. Sometimes it creates more opportunities to worry.
Try these guardrails:
- Decide what question you are studying before opening the report.
- When clinically appropriate, review lifestyle patterns at planned times rather than repeatedly refreshing the app.
- Keep medically necessary alerts active unless your care team advises otherwise.
- Use neutral words such as “higher,” “lower,” and “different” instead of “good,” “bad,” “success,” or “failure.”
- Focus on repeated patterns across several days.
- Change one variable at a time.
- Remember what the device cannot measure.
- Bring confusing patterns to a qualified health professional instead of trying to diagnose yourself.
If wearing a CGM increases anxiety, compulsive checking, food fear, or rigid eating behavior, step back and discuss that response with a health professional. More information is only helpful when it supports your health.
What about over-the-counter CGMs?
Some CGMs are available over the counter in the United States, while others require a prescription. Intended users, alerts, displayed ranges, medication-interference warnings, and whether the device is appropriate for treatment decisions differ by model.
Over-the-counter access does not make every device suitable for every person. Some systems are not intended for people who use insulin or experience problematic hypoglycemia. The FDA’s information about over-the-counter CGM clearance emphasizes checking the device’s intended use and speaking with a health professional before taking medical action.
A CGM is not a stand-alone screening or diagnostic test for prediabetes or diabetes. Appropriate blood testing and clinical interpretation are still required. The ADA’s 2026 diagnostic guidance notes that evidence is insufficient to use CGM alone for screening or diagnosis.
Questions to bring to your clinician
- Is this report based on enough representative data?
- What target range is appropriate for me?
- Do any possible low readings need immediate attention?
- Why might my GMI and laboratory A1C differ?
- Which repeated pattern matters most?
- Could my medication, supplements, sensor placement, or device model affect the readings?
- What is one safe change to test before my next review?
- When should I confirm a reading with a finger-stick meter or seek urgent care?
Frequently asked questions
Can a CGM diagnose diabetes or prediabetes?
No. A CGM may reveal patterns worth discussing, but diabetes and prediabetes are diagnosed using appropriate blood tests interpreted in clinical context. Do not self-diagnose from a sensor graph.
Why is my CGM different from a finger-stick reading?
A CGM estimates glucose in interstitial fluid, while a finger-stick meter tests a blood sample. The results may differ because of physiology, timing, measurement methods, or sensor conditions—particularly when glucose is changing quickly. Follow your device instructions when a reading does not match your symptoms or expectations.
What are time in range, time above range, and time below range?
They describe the percentage of CGM readings that fell within, above, or below a selected range. The appropriate range and goals depend on the person and clinical situation. Diabetes-management ranges should not be treated as universal wellness standards.
How many days of CGM data are useful?
For pattern assessment, professional guidance commonly uses about 14 days with at least 70% active data. A shorter period can still generate questions, but it may not represent your usual patterns reliably.
Is GMI the same as A1C?
No. GMI is calculated from average CGM glucose. A1C is a laboratory blood test. The numbers may differ, and GMI should not replace appropriate laboratory testing or diagnosis.
Is every rise after a meal a problem?
No. Glucose normally changes after eating, and the meaning of a pattern depends on the person, meal, treatment, size and duration of the change, and broader clinical context. Avoid judging a food from one reading.
Does a steady CGM line mean a food is good for me?
Not necessarily. A CGM measures glucose, not overall nutrition quality, fullness, cravings, digestive symptoms, or whether a food supports your broader health goals.
How can I use a CGM without checking it constantly?
Choose one question, log only the context relevant to it, review patterns at planned times when medically appropriate, and bring confusing results to your care team. Do not disable necessary safety alerts without guidance.
Let the data support you
A CGM does not need to become a daily report card. Its best use is often much simpler: confirm that the data are reliable, address safety signals, notice a repeat pattern, add context, and choose one appropriate next step.
The goal is not a perfect graph. It is a calmer, clearer understanding of what the data may—and may not—tell you, followed by a better conversation with your care team.
Want help turning CGM patterns into a personalized plan? Explore Virtual Metabolic Care.
Looking for a device without included medical interpretation? View Toward Health’s CGM purchase options. Purchase does not include medical advice; review results with your health care provider.
Turn your next question into a holiday plan
Want structured support with food choices, cravings, and holiday routines? Join Brian Wiley and Vic Basmadjian for Toward Health’s Holiday Bootcamp.
The eight-week small group meets Mondays starting October 26, 2026, at 5:30 p.m. Eastern. The $299 program includes one CGM, one 1:1 coaching visit, and Premium Toward Health app access. Group size is limited to 10 people.
Medical disclaimer: This article is for general educational purposes only and is not medical advice. Follow the instructions for your device and your individualized treatment plan. Do not use this article or a CGM reading alone to diagnose a condition or make an unplanned medication or insulin change. Discuss personal targets, symptoms, and unexpected readings with a qualified health professional.