
What is a Calcium Score?
In order to understand what a calcium score is, we must first understand how heart attacks occur. The initial stage of heart disease includes the formation of fatty plaques in the artery walls of the heart. The body, to protect itself, eventually puts calcium over these plaques to help stabilize them. This is analogous to fixing a pothole: there is damage done over time to the road, resulting in a non-smooth surface. Eventually, road workers come along and place concrete into the pothole. In this scenario, the concrete is the calcium, which is evidence that damage was done to the road/ arteries of the heart.

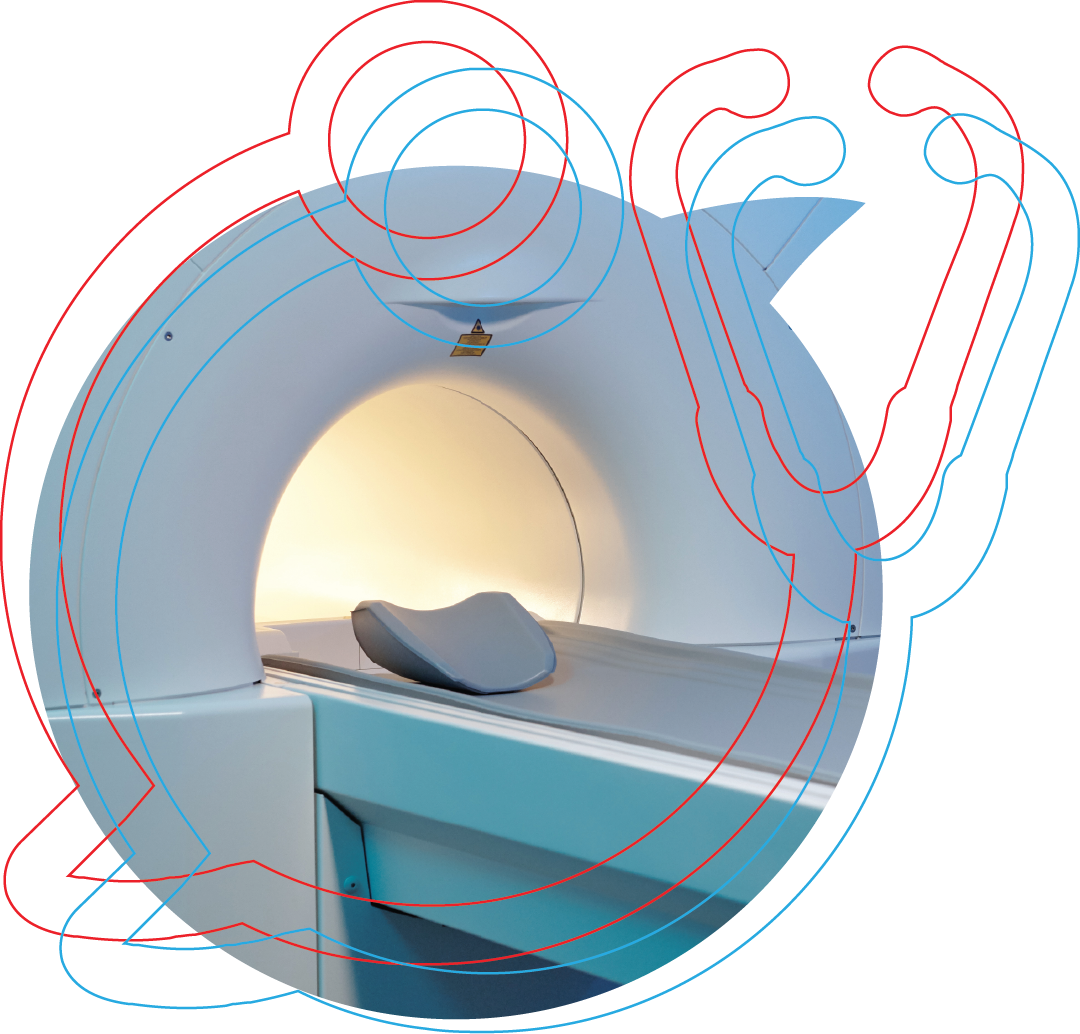
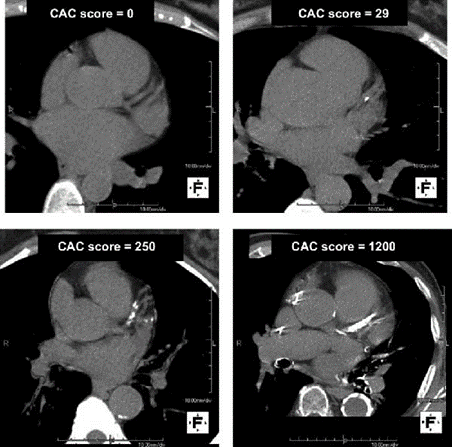
A calcium score is a number that is calculated from a calcium scan, which is a CT scan of the heart. The CT scan takes only a few moments to complete. Importantly, calcium on CT scans show up as white while other tissue (the heart muscle, the walls of arteries and veins, etc.) show up as various shades of gray. We can count how large the area of white calcium is on the CT scan. We then compare the area of calcium to age-matched individuals through a database of hundreds of thousands of subjects to determine how much calcium a patient has compared to the average person their age. Higher numbers are worse; it demonstrates that there has been more damage done to the arteries of the heart and helps predict who is at the greatest risk of heart attacks over the next few years to decades.
Major Point: Calcium scans detect heart disease by looking for damage that has been done to the heart.
Will I be exposed to dangerous radiation during a Calcium Scan?
CT scans use ionizing radiation to obtain images. This is in contrast to some other sources of radiation that are mostly nonionizing, such as the sun. Ionizing radiation is more dangerous because it has more energy than nonionizing, which means it can cause cellular disruption.
However, the ionizing dose of radiation from a calcium scan is relatively small. The unit of radiation is the sievert, or Sv. The average radiation dose of a calcium scan is ~1mSv (a millisievert). The annual allotment of radiation exposure allowed for occupations is 50mSv per year. This is because at this level, there is no detectable increase risk in cancer. For comparison, a mammogram is 0.4 mSv and a normal chest CT scan is 7 mSv. The radiation dose per year just from background radiation exposure for the average American is between 3-7 mSv, depending on geographic altitude.
Major Point: Calcium scans use ionizing radiation like Xrays or CT scans. It is about ¼ the dose of the average background radiation per year.
The Power of a Zero Calcium Score
The leading cause of death is cardiovascular disease, which includes heart attacks. The most common way to assess the risk of a heart attack in a traditional office is by measuring your cholesterol. This is imprecise; many people with high cholesterol will not develop heart disease while many with low cholesterol will. Additionally, family history of early heart disease may suggest that there are genetic concerns that make an individual’s risk much higher than what traditional risk factors would suggest. A calcium scan lets you see the extent of actual heart disease that is occurring.
How reassured can you be from a calcium score of zero? One study followed the heart disease outcomes of 6698 individuals after obtaining a calcium scan. Participants were separated into categories based on the number of heart disease risk factors, including current smoking, hypertension, diabetes, LDL >130 mg/dL, and low HDL. Coronary heart disease events were recorded over an average follow up time of about 7 years. The study outcome included heart attacks, coronary deaths and angina-related events.
The results showed that a calcium score of zero was associated with a low frequency of coronary heart disease events, whether you had zero, one, two, or more risk factors listed above. Below are the observed proportions with coronary heart disease events over about 7 years in the different study groups:
Coronary heart disease events over about 7 years
| Number of risk factors* | Participants with CHD events |
|---|---|
| 0 | 1.5% |
| 1 | 3.5% |
| 2 | 5.9% |
| ≥3 | 9.5% |
| Calcium score | Participants with CHD events |
|---|---|
| CAC 0 | 1.3% |
| CAC 1–100 | 4.8% |
| CAC 101–300 | 9.8% |
| CAC >300 | 16.5% |
*Risk factors include current smoking, LDL >130 mg/dL, low HDL, hypertension, and diabetes. These are observed study-group proportions, not an individual forecast. Read the primary MESA study.
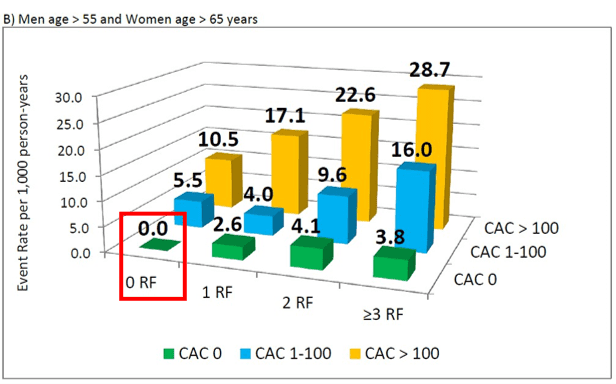
The table shows a lower observed proportion of coronary heart disease events among participants with a calcium score of 0 than among participants with 0 of the traditional risk factors. This study has a very important caveat: individuals with a calcium score of 0 were, on average, 6-12 years younger than subjects with a higher calcium score. The average age for participants with a calcium score of [0], [1-100], [101-300], and [> 300] was 58, 64, 67, and 70, respectively. Age is, by far, the single most powerful predictor of heart attack risk; the older you are, the higher your risk of heart attack. The authors conducted a subgroup analysis of men >55 years old and women >65 years old, and a calcium score of zero was still associated with a low rate of coronary heart disease events. Also note the red box: older subjects with zero calcium score and zero risk factors had no coronary heart disease events over the 7 year study.
If you are only 40 years old, it would be very rare to have a positive calcium scan and therefore a score of zero may not be that telling. However, if you are 40 and have a positive score, then you may need to be much more aggressive on treatment compared to someone who would be expected to have some level of calcium detected at an older age.
Depending on your individual risk factors and family history, this could help determine if you get your first scan before the age of 40.
Major Point: In this study, participants with a calcium score of zero had coronary heart disease events at a frequency of about 1% over 7 years.
When Should I Repeat My Calcium Scan?
Per our discussion above, a calcium score of zero grants an extremely low risk of a heart attack in the next few years. However, it is advantageous to know if your calcium score increases from zero as soon as possible. This increase in calcium demonstrates an increased risk of heart attack and may warrant closer monitoring, lifestyle changes, or medications. Therefore, the next logical question after having a calcium score of zero is when should you repeat your calcium scan to ensure it is staying there.
Another study answered just that question. The study included 3,116 subjects with a baseline calcium score of zero and follow-up scans over 10 years after baseline. The average age was 58 years and subjects had a baseline 10 year heart attack risk of 14%. The study showed that about 2-3% of subjects would develop a positive CAC score per year over the first 2 years which increases to 4-5% per year in the 4- to 10-year period after the baseline scan. The total prevalence of subjects with a [CAC >0] after a baseline [CAC=0] is shown below in the left table. The right table shows the total prevalence of subjects with [CAC>100]. Remember, a [CAC=1] and [CAC=100] have vastly different risks. It is good news that less than 10% of subjects will increase from [CAC=0] to [CAC >100] over 10 years!
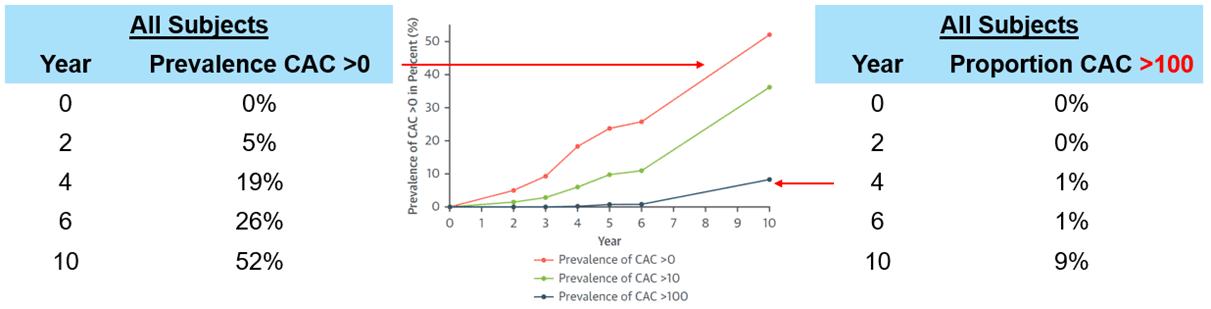
The study indicates that if we scanned the entire population in the relevant age groups every three years then we would find about 15% of cases where people move from the [CAC=0] to [CAC>0] – meaning relatively early. Furthermore, calcium scores will increase more quickly in patients that have more risk factors, like diabetes, than in those without. Therefore, for some higher risk individuals, it may be worth repeating before 3 years.
Major Point: After a baseline CAC=0, calcium scans may be repeated every 3 years (although for some individuals it may be worthwhile obtaining them sooner).
How our view of PCSK9 inhibitors changed:
Toward Health has re-evaluated PCSK9 inhibitors as the evidence has developed. Lowering LDL cholesterol, preventing cardiovascular events and reducing deaths are different outcomes. Our earlier concerns about mortality deserve to be explained alongside our current conclusion.
Early evidence, 2017–2019: FOURIER (2017) reduced major cardiovascular events but did not demonstrate a reduction in all-cause or cardiovascular mortality. Both were numerically higher with evolocumab: all-cause deaths were 3.2% versus 3.1%, and cardiovascular deaths were 1.8% versus 1.7%. Neither difference was statistically significant.
ODYSSEY OUTCOMES and its 2019 mortality analysis need a distinction: all-cause deaths were lower with alirocumab, 3.5% versus 4.1%, but the result was only nominally significant because the trial’s prespecified testing hierarchy had already stopped at a nonsignificant outcome. Cardiovascular mortality was not significantly reduced. The early trials therefore did not establish a consistent, definitive survival benefit across the class.
Why the mortality reanalysis concerned us: A BMJ Open reanalysis, submitted in 2021 and published in December 2022, found discrepancies in FOURIER death classifications using regulatory clinical-study reports. After readjudication, cardiovascular deaths were more frequent with evolocumab (relative risk 1.20; 95% confidence interval 0.95–1.51). This was a concerning signal, although it did not establish that the drug increased mortality. The investigators could not re-evaluate nonfatal events. We regarded the mortality and reporting questions as reasons for caution.
What changed our assessment: We have now reviewed the longer-term and newer evidence:
- FOURIER-OLE (2022) associated earlier evolocumab treatment with fewer cardiovascular events and cardiovascular deaths. These were exploratory comparisons of earlier versus delayed initiation; both groups received evolocumab during the extension.
- The long-term ODYSSEY OUTCOMES analysis (2023) supported sustained cardiovascular benefit and reassuring safety through follow-up of up to five years, with more injection-site reactions than placebo.
- VESALIUS-CV (2026; online 2025) strengthened the evidence in high-risk patients without a previous heart attack or stroke: five-year coronary death, heart attack or ischemic stroke risk was 6.2% versus 8.0%, an absolute difference of 1.8 percentage points.
After this reassessment, we agree that PCSK9 inhibitors such as alirocumab (Praluent) and evolocumab (Repatha) can be effective options for selected patients with coronary artery disease or other high-risk conditions. This updated position reflects the evolving evidence, while keeping cardiovascular-event reduction distinct from a claim of universal survival benefit.
For plaque regression, separate imaging trials, GLAGOV and PACMAN-AMI, found greater coronary plaque regression when a PCSK9 inhibitor was added to statin therapy. These findings do not establish that CAC scores will fall. Treatment remains individualized to disease burden, overall risk, existing therapy, tolerability and patient preferences.